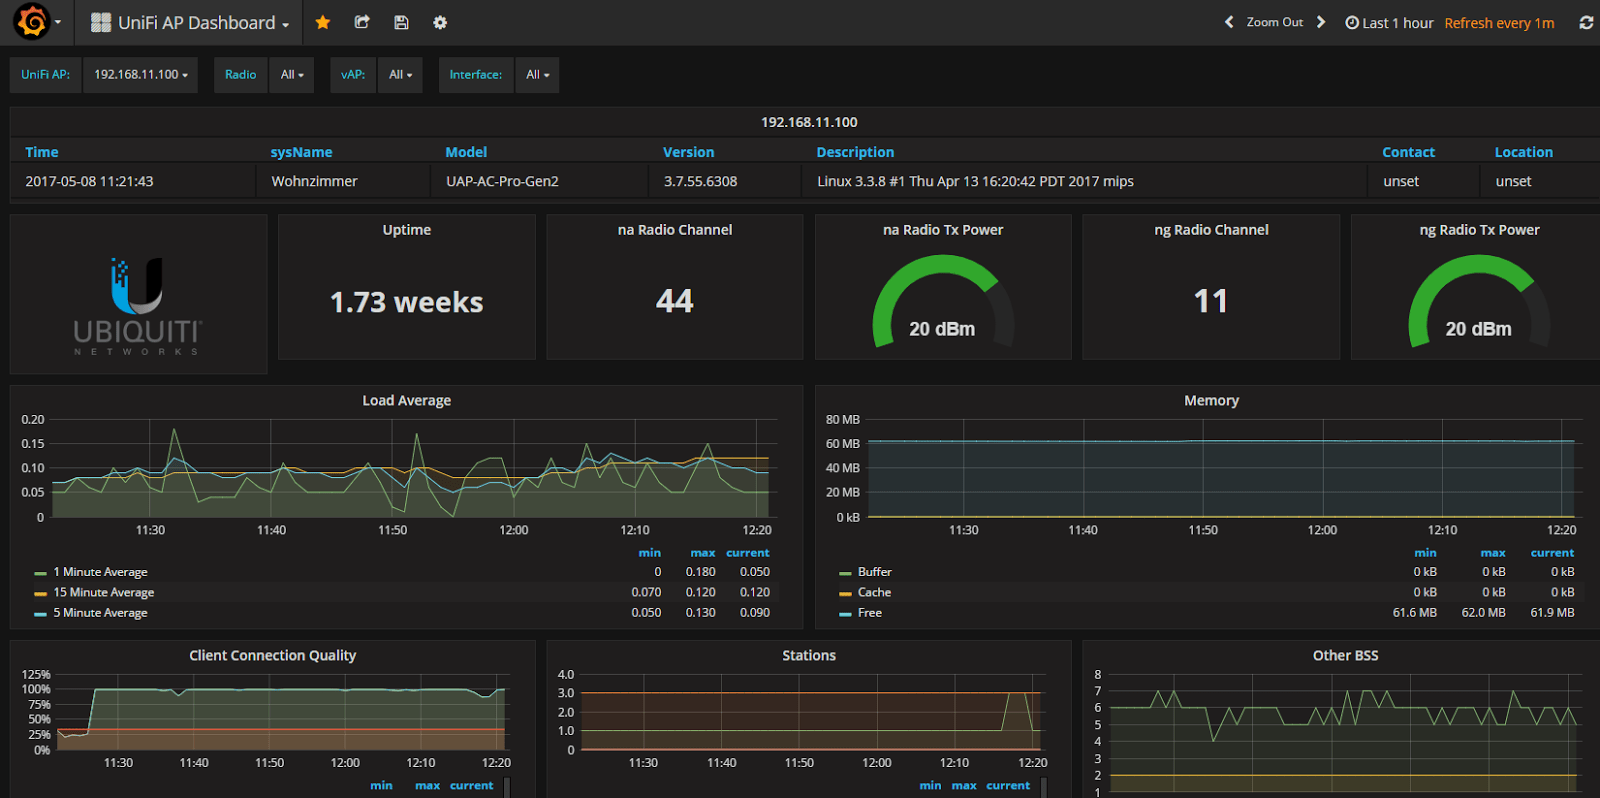
Im Internet bin ich über folgendes schöne Grafana Dashboard gestolpert und wollte es natürlich gleich selbst ausprobieren.
Ich werde hier also beschreiben wie ich
- InfluxDB, als Datenbank
- Telegraf als Collector
- Grafana als Visualisierung
1. InfluxDB installieren
Die Daten werden alle in der InfluxDB gesammelt. Die aktuelle Version findet ihr hier.
 wget https://dl.influxdata.com/influxdb/releases/influxdb_1.5.1_armhf.deb
 sudo dpkg -i influxdb_1.5.1_armhf.deb
 sudo systemctl enable influxdb
 sudo systemctl start influxdb
Damit installiert ihr InfluxDB in der Version 1.2.2, aktiviert den automatischen start und startet die Datenbank.
 pi@raspberrypi:/etc/telegraf $ influx
 Connected to http://localhost:8086 version 1.2.2
 InfluxDB shell version: 1.2.2
 > CREATE USER admin WITH PASSWORD '<password>' WITH ALL PRIVILEGES
 > CREAT DATABASE telegraf
 > exit
Damit legen wir einen User admin an und erzeigen die später verwendete Datenbank.
 sudo vi /etc/influxdb/influxdb.conf
 [http]
  enabled = true
  bind-address = ":8086"
  auth-enabled = true
Durch diese Anpassung in der influxdb.conf, aktivieren wir die Authentifizierung. Diese drei Parameter unter [http] sollten überprüft und entsprechend angepasst werden.
 sudo systemctl restart influxdb
 influx -username admin -password password
Nach einem Neustart des Services, ist der Zugang nur noch mittels Username und Passwort möglich.
2. Telegraf installieren
Telegraf ist der Collector und holt sich alle Daten per SNMP von den Accesspoints. Dazu muss natürlich SNMP und der entsprechende Community String im UniFi Controller konfiguriert werden. Die aktuelle Version findet ihr hier.
 wget https://dl.influxdata.com/telegraf/releases/telegraf_1.2.1_armhf.deb
 sudo dpkg -i telegraf_1.2.1_armhf.deb
Damit ladet ihr euch Telegraf und installiert es anschließend.
 wget https://github.com/WaterByWind/grafana-dashboards/archive/master.zip
 unzip master.zip
 sudo cp grafana-dashboards-master/UniFi-UAP/mibs/* /usr/share/snmp/mibs
 sudo apt-get install snmpd
Damit Telegraf die Daten auswerten kann, müssen die MIBs installiert werden und snmpd. Die MIBs sind im GitHUB Repository des Dashboards bereits enthalten und müssen nur kopiert werden.
Anschließend muss Telegraf konfiguriert werden.
Hier ist meine gesamte telegraf.conf. Wichtig sind die Abschnitte Input und Output. Alles rot markierte müsst ihr anpassen. Wenn ihr bereits eine Telegraf Instanz nutzt, könnt ihr eure Config um die entsprechenden Daten ergänzen, also den kompletten Input-Abschnitt mindestens. Den Communuity-String müsst ihr entsprechend euren Einstellungen im UniFi-Controller anpassen und ip-ap-1 durch die IP oder den DNS-Namen eures Accesspoints.
# Telegraf Configuration # # Telegraf is entirely plugin driven. All metrics are gathered from the # declared inputs, and sent to the declared outputs. # # Plugins must be declared in here to be active. # To deactivate a plugin, comment out the name and any variables. # # Use 'telegraf -config telegraf.conf -test' to see what metrics a config # file would generate. # # Environment variables can be used anywhere in this config file, simply prepend # them with $. For strings the variable must be within quotes (ie, "$STR_VAR"), # for numbers and booleans they should be plain (ie, $INT_VAR, $BOOL_VAR) # Global tags can be specified here in key="value" format. [global_tags] # dc = "us-east-1" # will tag all metrics with dc=us-east-1 # rack = "1a" ## Environment variables can be used as tags, and throughout the config file # user = "$USER" # Configuration for telegraf agent [agent] ## Default data collection interval for all inputs interval = "10s" ## Rounds collection interval to 'interval' ## ie, if interval="10s" then always collect on :00, :10, :20, etc. round_interval = true ## Telegraf will send metrics to outputs in batches of at most ## metric_batch_size metrics. ## This controls the size of writes that Telegraf sends to output plugins. metric_batch_size = 1000 ## For failed writes, telegraf will cache metric_buffer_limit metrics for each ## output, and will flush this buffer on a successful write. Oldest metrics ## are dropped first when this buffer fills. ## This buffer only fills when writes fail to output plugin(s). metric_buffer_limit = 10000 ## Collection jitter is used to jitter the collection by a random amount. ## Each plugin will sleep for a random time within jitter before collecting. ## This can be used to avoid many plugins querying things like sysfs at the ## same time, which can have a measurable effect on the system. collection_jitter = "0s" ## Default flushing interval for all outputs. You shouldn't set this below ## interval. Maximum flush_interval will be flush_interval + flush_jitter flush_interval = "10s" ## Jitter the flush interval by a random amount. This is primarily to avoid ## large write spikes for users running a large number of telegraf instances. ## ie, a jitter of 5s and interval 10s means flushes will happen every 10-15s flush_jitter = "0s" ## By default, precision will be set to the same timestamp order as the ## collection interval, with the maximum being 1s. ## Precision will NOT be used for service inputs, such as logparser and statsd. ## Valid values are "ns", "us" (or "µs"), "ms", "s". precision = "" ## Logging configuration: ## Run telegraf with debug log messages. # debug = true ## Run telegraf in quiet mode (error log messages only). quiet = false ## Specify the log file name. The empty string means to log to stderr. logfile = "/var/log/telegraf/telegraf.log" ## Override default hostname, if empty use os.Hostname() hostname = "" ## If set to true, do no set the "host" tag in the telegraf agent. omit_hostname = false ############################################################################### # OUTPUT PLUGINS # ############################################################################### # Configuration for influxdb server to send metrics to [[outputs.influxdb]] ## The full HTTP or UDP endpoint URL for your InfluxDB instance. ## Multiple urls can be specified as part of the same cluster, ## this means that only ONE of the urls will be written to each interval. urls = ["http://localhost:8086"] # required ## The target database for metrics (telegraf will create it if not exists).database = "telegraf" # required## Retention policy to write to. Empty string writes to the default rp. retention_policy = "" ## Write consistency (clusters only), can be: "any", "one", "quorum", "all" write_consistency = "any" ## Write timeout (for the InfluxDB client), formatted as a string. ## If not provided, will default to 5s. 0s means no timeout (not recommended). timeout = "5s"username = "admin" password = "password"## Set the user agent for HTTP POSTs (can be useful for log differentiation) user_agent = "telegraf" ############################################################################### # PROCESSOR PLUGINS # ############################################################################### # # Print all metrics that pass through this filter. # [[processors.printer]] ############################################################################### # AGGREGATOR PLUGINS # ############################################################################### # # Keep the aggregate min/max of each metric passing through. # [[aggregators.minmax]] # ## General Aggregator Arguments: # ## The period on which to flush & clear the aggregator. # period = "30s" # ## If true, the original metric will be dropped by the # ## aggregator and will not get sent to the output plugins. # drop_original = false # Telegraf Configuration for UniFi UAP monitoring via SNMP # These input configurations are required for use with the dashboard # Edit the list of monitored hosts ("agents") # and SNMP community string ("community") as appropriate. ############################################################################### # INPUT PLUGINS # ############################################################################### ## ## Retrieves details via SNMP from remote agents ## ## ## UniFi APs (Gen 2/Gen 3) ## [[inputs.snmp]] # List of agents to pollagents = [ "ip-ap-1", "ip-ap-2" ]# Polling interval interval = "60s" # Timeout for each SNMP query. timeout = "10s" # Number of retries to attempt within timeout. retries = 3 # SNMP version, UAP only supports v1 version = 1 # SNMP community string.community = "public"# The GETBULK max-repetitions parameter max_repetitions = 10 # Measurement name name = "snmp.UAP" ## ## System Details ## # System name (hostname) [[inputs.snmp.field]] is_tag = true name = "sysName" oid = "RFC1213-MIB::sysName.0" # System vendor OID [[inputs.snmp.field]] name = "sysObjectID" oid = "RFC1213-MIB::sysObjectID.0" # System description [[inputs.snmp.field]] name = "sysDescr" oid = "RFC1213-MIB::sysDescr.0" # System contact [[inputs.snmp.field]] name = "sysContact" oid = "RFC1213-MIB::sysContact.0" # System location [[inputs.snmp.field]] name = "sysLocation" oid = "RFC1213-MIB::sysLocation.0" # System uptime [[inputs.snmp.field]] name = "sysUpTime" oid = "RFC1213-MIB::sysUpTime.0" # UAP model [[inputs.snmp.field]] name = "unifiApSystemModel" oid = "UBNT-UniFi-MIB::unifiApSystemModel" # UAP firmware version [[inputs.snmp.field]] name = "unifiApSystemVersion" oid = "UBNT-UniFi-MIB::unifiApSystemVersion" ## ## Host Resources ## # Total memory [[inputs.snmp.field]] name = "memTotal" oid = "FROGFOOT-RESOURCES-MIB::memTotal.0" # Free memory [[inputs.snmp.field]] name = "memFree" oid = "FROGFOOT-RESOURCES-MIB::memFree.0" # Buffer memory [[inputs.snmp.field]] name = "memBuffer" oid = "FROGFOOT-RESOURCES-MIB::memBuffer.0" # Cache memory [[inputs.snmp.field]] name = "memCache" oid = "FROGFOOT-RESOURCES-MIB::memCache.0" # Per-interface traffic, errors, drops [[inputs.snmp.table]] oid = "IF-MIB::ifTable" [[inputs.snmp.table.field]] is_tag = true oid = "IF-MIB::ifDescr" ## ## Interface Details & Metrics ## # Wireless interfaces [[inputs.snmp.table]] oid = "UBNT-UniFi-MIB::unifiRadioTable" [[inputs.snmp.table.field]] is_tag = true oid = "UBNT-UniFi-MIB::unifiRadioName" [[inputs.snmp.table.field]] is_tag = true oid = "UBNT-UniFi-MIB::unifiRadioRadio" # BSS instances [[inputs.snmp.table]] oid = "UBNT-UniFi-MIB::unifiVapTable" [[inputs.snmp.table.field]] is_tag = true oid = "UBNT-UniFi-MIB::unifiVapName" [[inputs.snmp.table.field]] is_tag = true oid = "UBNT-UniFi-MIB::unifiVapRadio" # Ethernet interfaces [[inputs.snmp.table]] oid = "UBNT-UniFi-MIB::unifiIfTable" [[inputs.snmp.table.field]] is_tag = true oid = "UBNT-UniFi-MIB::unifiIfName" ## ## System Performance ## # System load averages [[inputs.snmp.table]] oid = "FROGFOOT-RESOURCES-MIB::loadTable" [[inputs.snmp.table.field]] is_tag = true oid = "FROGFOOT-RESOURCES-MIB::loadDescr" ## ## SNMP metrics ## # Number of SNMP messages received [[inputs.snmp.field]] name = "snmpInPkts" oid = "SNMPv2-MIB::snmpInPkts.0" # Number of SNMP Get-Request received [[inputs.snmp.field]] name = "snmpInGetRequests" oid = "SNMPv2-MIB::snmpInGetRequests.0" # Number of SNMP Get-Next received [[inputs.snmp.field]] name = "snmpInGetNexts" oid = "SNMPv2-MIB::snmpInGetNexts.0" # Number of SNMP objects requested [[inputs.snmp.field]] name = "snmpInTotalReqVars" oid = "SNMPv2-MIB::snmpInTotalReqVars.0" # Number of SNMP Get-Response received [[inputs.snmp.field]] name = "snmpInGetResponses" oid = "SNMPv2-MIB::snmpInGetResponses.0" # Number of SNMP messages sent [[inputs.snmp.field]] name = "snmpOutPkts" oid = "SNMPv2-MIB::snmpOutPkts.0" # Number of SNMP Get-Request sent [[inputs.snmp.field]] name = "snmpOutGetRequests" oid = "SNMPv2-MIB::snmpOutGetRequests.0" # Number of SNMP Get-Next sent [[inputs.snmp.field]] name = "snmpOutGetNexts" oid = "SNMPv2-MIB::snmpOutGetNexts.0" # Number of SNMP Get-Response sent [[inputs.snmp.field]] name = "snmpOutGetResponses" oid = "SNMPv2-MIB::snmpOutGetResponses.0"
Dieser Befehl testet ob die Datenabfrage soweit funktioniert.
sudo -u telegraf telegraf --config /etc/telegraf/telegraf.conf --config-directory /etc/telegraf/telegraf.d/ --input-filter snmp -test
Wenn die Daten auch in die InfluxDB geschrieben werden, seht hier folgende Tabellen:
 pi@raspberrypi:~ $ influx -username admin -password yourpassword
 Connected to http://localhost:8086 version 1.2.2
 InfluxDB shell version: 1.2.2
 > use telegraf
 Using database telegraf
 > show measurements
 name: measurements
 name
 ----
 ifTable
 loadTable
 snmp.UAP
 unifiIfTable
 unifiRadioTable
 unifiVapTable
Ihr könnt damit testen ob die Daten auch in die InfluxDB geschrieben werden.
3. Grafana installieren
Bald haben wir es geschafft, es muss nur noch Grafana installiert und angepasst werden. Die aktuelle Version findet ihr hier.
 wget https://github.com/fg2it/grafana-on-raspberry/releases/download/v4.6.3/grafana_4.6.3_armhf.deb
 sudo dpkg -i grafana_4.6.3_armhf.deb
 sudo systemctl enable grafana-server
 sudo systemctl start grafana-server
Damit habt ihr Grafana installiert und gestartet.
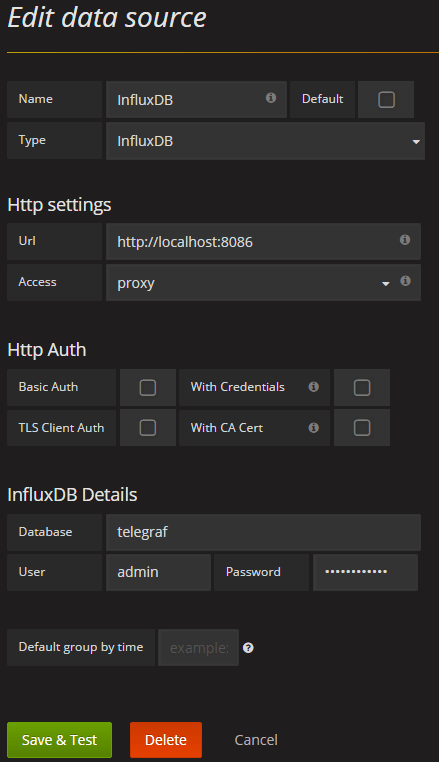
Ihr erreicht euer Grafana nun über http://<yourip>:3000. Als Login verwendet ihr admin / admin. Anschließend solltet ihr unter http://<yourip>:3000/profile/password euer Passwort ändern. Anschließend müsst ihr noch eure Datenquelle angeben.
Nun könnt ihr das Dashboard importieren und eure Daten betrachten.


E! Error in plugin [inputs.snmp]: agent ip-ap-2: setting up connection: Error establishing connection to host: dial udp: lookup ip-ap-2 on 192.168.1.1:53: no such host
E! Error in plugin [inputs.snmp]: agent ip-ap-1: setting up connection: Error establishing connection to host: dial udp: lookup ip-ap-1 on 192.168.1.1:53: no such host
Ich bekomme leider diesen ERROR was muss ich statt den ip-ap-2 eintragen :))
Hi,
ich gebe zu, ich hab es etwas schlecht erklärt.
Anstelle ip-ap-1 und ip-ap-2, trägst du dort den DNS-Namen deines AccessPoints ein, oder die IP-Adresse.
Grüße,
Björn
Hi Bjoern,
hab gestern Telegraf in Betrieb genommen mit leichten Anlaufschwierigkeiten und finde HEUTE deine Anleitung.
Gut gemacht, deine Anleitung
Grüße
Reinhard
Hi, habe die Anleitung soweit befolgt und bekomme aber beim testen der telegraf.conf folgende Fehler:
„root@RPi3:~# sudo -u telegraf telegraf –config /etc/telegraf/telegraf.conf –config-directory /etc/telegraf/telegraf.d/ –input-filter snmp -test
2018-08-06T13:22:45Z E! initializing table : translating: exit status 2: MIB search path: /etc/telegraf/.snmp/mibs:/usr/share/snmp/mibs:/usr/share/snmp/mibs/iana:/usr/share/snmp/mibs/ietf:/usr/share/mibs/site:/usr/share/snmp/mibs:/usr/share/mibs/iana:/usr/share/mibs/ietf:/usr/share/mibs/netsnmp
Cannot find module (IF-MIB): At line 1 in (none)
IF-MIB::ifTable: Unknown Object Identifier“
Die MIBs befinden sich in /usr/share/snmp/mibs
„root@RPi3:~# ls -alh /usr/share/snmp/mibs
total 352K
drwxr-xr-x 2 root root 4.0K Aug 6 15:25 .
drwxr-xr-x 5 root root 4.0K Aug 6 11:43 ..
-rw-r–r– 1 root root 8.8K Aug 6 15:21 FROGFOOT-RESOURCES-MIB
-rw-r–r– 1 root root 1.9K Jan 24 2017 GNOME-SMI.txt
-rw-r–r– 1 root root 6.7K Dec 8 2014 IANA-ADDRESS-FAMILY-NUMBERS-MIB.txt
-rw-r–r– 1 root root 33K Dec 8 2014 IANAifType-MIB.txt
-rw-r–r– 1 root root 4.3K Dec 8 2014 IANA-LANGUAGE-MIB.txt
-rw-r–r– 1 root root 3.8K Dec 8 2014 IANA-RTPROTO-MIB.txt
-rw-r–r– 1 root root 5.8K Dec 8 2014 LM-SENSORS-MIB.txt
-rw-r–r– 1 root root 965 Apr 11 2015 miblist.txt
-rw-r–r– 1 root root 16K Dec 8 2014 NET-SNMP-AGENT-MIB.txt
-rw-r–r– 1 root root 9.0K Dec 8 2014 NET-SNMP-EXAMPLES-MIB.txt
-rw-r–r– 1 root root 9.2K Dec 8 2014 NET-SNMP-EXTEND-MIB.txt
-rw-r–r– 1 root root 2.0K Dec 8 2014 NET-SNMP-MIB.txt
-rw-r–r– 1 root root 1.2K Dec 8 2014 NET-SNMP-MONITOR-MIB.txt
-rw-r–r– 1 root root 3.3K Dec 8 2014 NET-SNMP-PASS-MIB.txt
-rw-r–r– 1 root root 2.5K Dec 8 2014 NET-SNMP-PERIODIC-NOTIFY-MIB.txt
-rw-r–r– 1 root root 1.2K Dec 8 2014 NET-SNMP-SYSTEM-MIB.txt
-rw-r–r– 1 root root 4.8K Dec 8 2014 NET-SNMP-TC.txt
-rw-r–r– 1 root root 5.0K Dec 8 2014 NET-SNMP-VACM-MIB.txt
-rw-r–r– 1 root root 1.2K Dec 8 2014 RFC-1215.txt
-rw-r–r– 1 root root 43K Dec 8 2014 SNMP-TLS-TM-MIB.txt
-rw-r–r– 1 root root 8.8K Dec 8 2014 SNMP-TSM-MIB.txt
-rw-r–r– 1 root root 4.0K Aug 6 15:21 UBNT-MIB
-rw-r–r– 1 root root 14K Aug 6 15:21 UBNT-UniFi-MIB
-rw-r–r– 1 root root 2.2K Dec 8 2014 UCD-DEMO-MIB.txt
-rw-r–r– 1 root root 4.6K Dec 8 2014 UCD-DISKIO-MIB.txt
-rw-r–r– 1 root root 3.1K Dec 8 2014 UCD-DLMOD-MIB.txt
-rw-r–r– 1 root root 6.4K Dec 8 2014 UCD-IPFILTER-MIB.txt
-rw-r–r– 1 root root 8.0K Dec 8 2014 UCD-IPFWACC-MIB.txt
-rw-r–r– 1 root root 18K Dec 8 2014 UCD-SNMP-MIB-OLD.txt
-rw-r–r– 1 root root 49K Dec 8 2014 UCD-SNMP-MIB.txt“
Hallo Markus,
eventuell kannst du das MIB File manuell hinzufügen:
http://www.net-snmp.org/docs/mibs/IF-MIB.txt